


How to build a Recruiting Dashboard
posted on 20 Jul 2021
This project started as a small personal side project. My main purpose for it was to give myself an excuse to learn NodeJS and improve my programming skills. Fast forward a couple of months later, we use my dashboards in recruitment meetings to gain deeper insights and I’m collaborating with the Data Department to make more advanced recruiting and HR dashboards accessible for the whole organization.
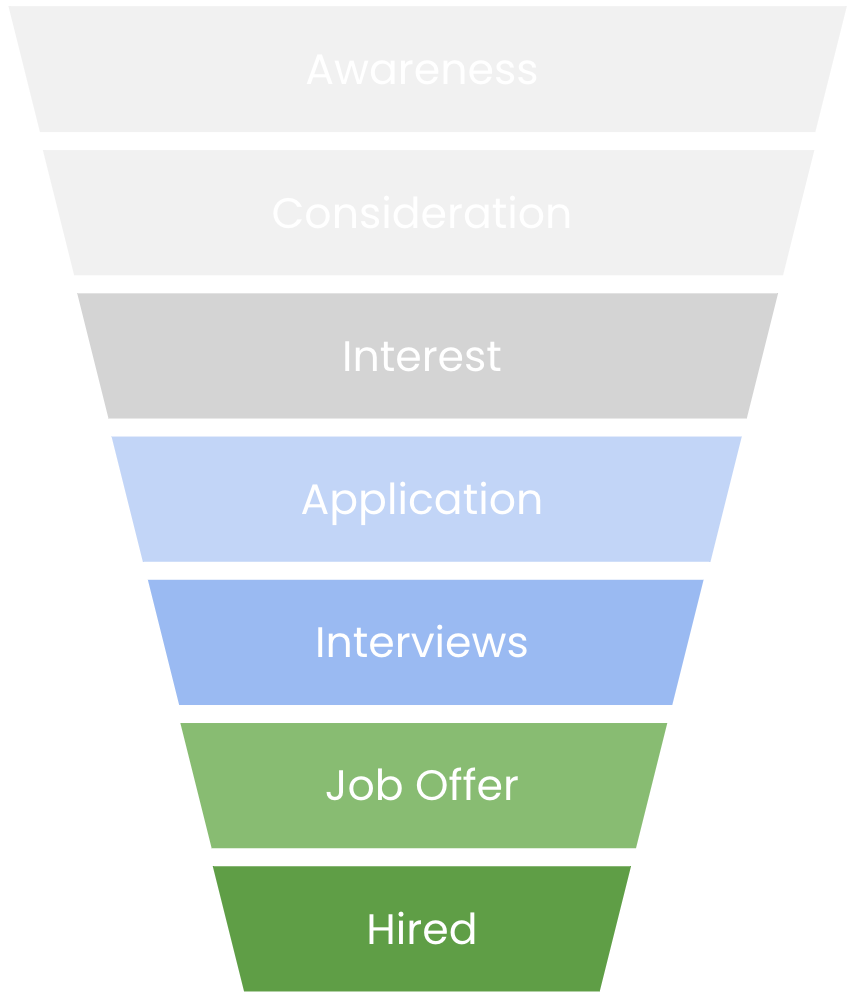
Recruiting as a Funnel Business
As a Recruiter, my primary goal is to find the best people for the organisation I’m working for and get them on board. Recruiting is not just about screening, but also about selling. It’s a candidate-driven market, especially when you are competing for the world’s best tech talent. Recruiting is a Funnel Business. And like for any other funnel business, data informed decisions are critical for business success.
The Problem
… with most built-in analytics solutions of recruiting softwares is that they are:
- 😒 inflexible
- 😓 very user-unfriendly
- 😩 sometimes you don’t even know how exactly the software calculates a certain metric.
Over the years, I already worked with a lot of different Recruiting-Softwares. None of them provided a sufficient analytics dashboard. Additional time consuming manual track-keeping was always necessary. So at some point, I just decided to build my own Recruiting Dashboard. Or at least to try it and give myself an excuse to dive deeper into the rabbit whole of programming.
Basic Dashboard Requirements
In Recruiting, there are potentially a lot of interesting and relevant metrics to track. But since we are in a funnel business, it just makes sense to start with the basic funnel metrics. This is the very first draft I made, just to get the idea along.
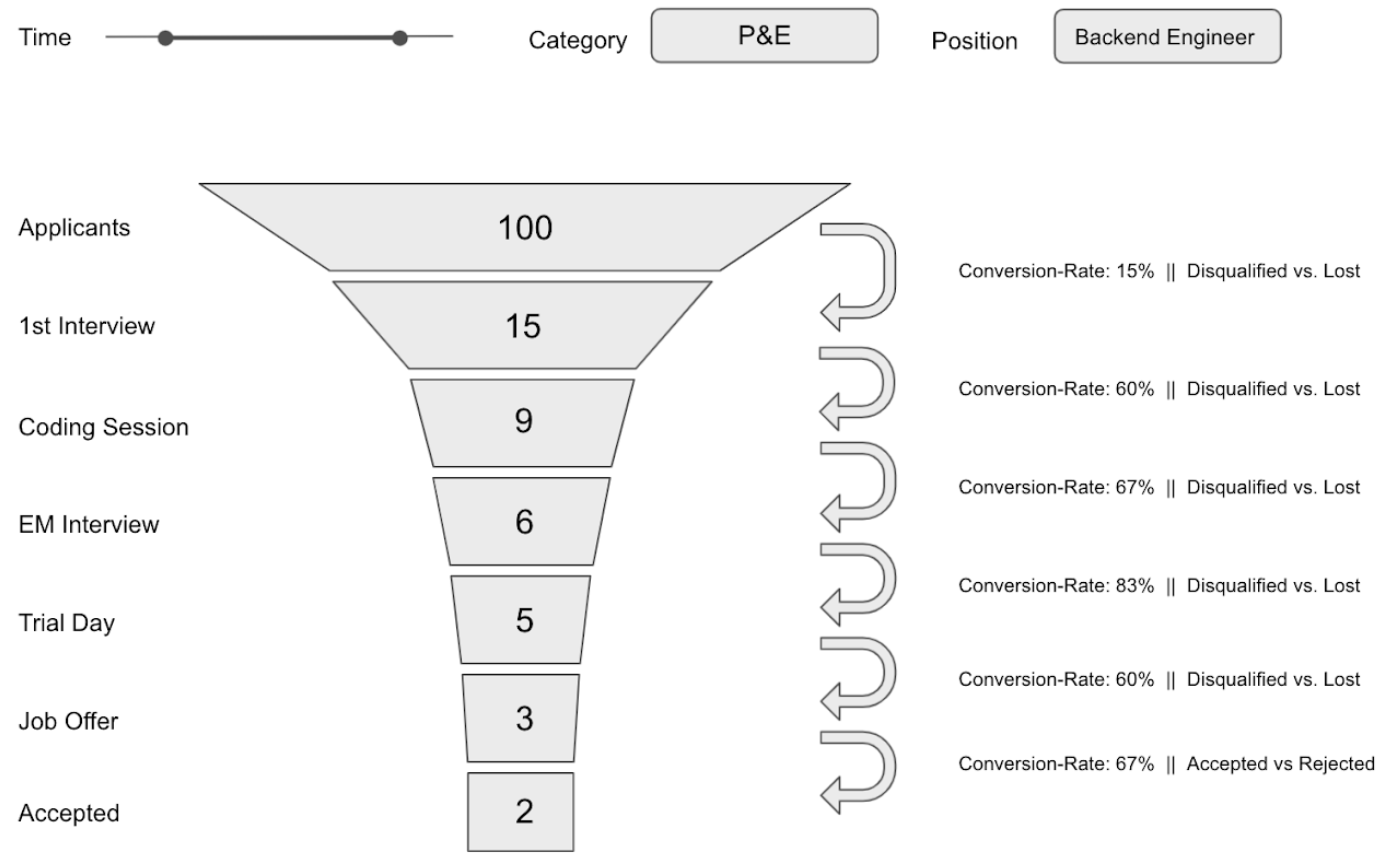
Within a given timeframe, the dashboard should be able to show how many candidates entered the pipeline, how many first-, second-, third-, fourth interviews took place, how many jonb offers were extended and how many new hires we had. Also, one should be able to filter these numbers for specific departments and/or postions.
These were my absolute minimum requirements in the beginning. But knowing that the mimimum requirements won’t satisfy a recruiter’s curiosity, I also added the infomration of candidate source (active sourcing, application, employee referrals ..) as well as timestamps for every action that was taken with that candidate.
Tracking these metrics is no rocket science. And it’s also done by most recruiting teams, but in a manual, time-consuming and visually unappealing way. So the critical parts for me were automation and visualisation.
Where does the data live?
The next question was: Where do I find the data I need? Where does the data live? Together with the first dashboard-draft, I drafted this very basic architecture.
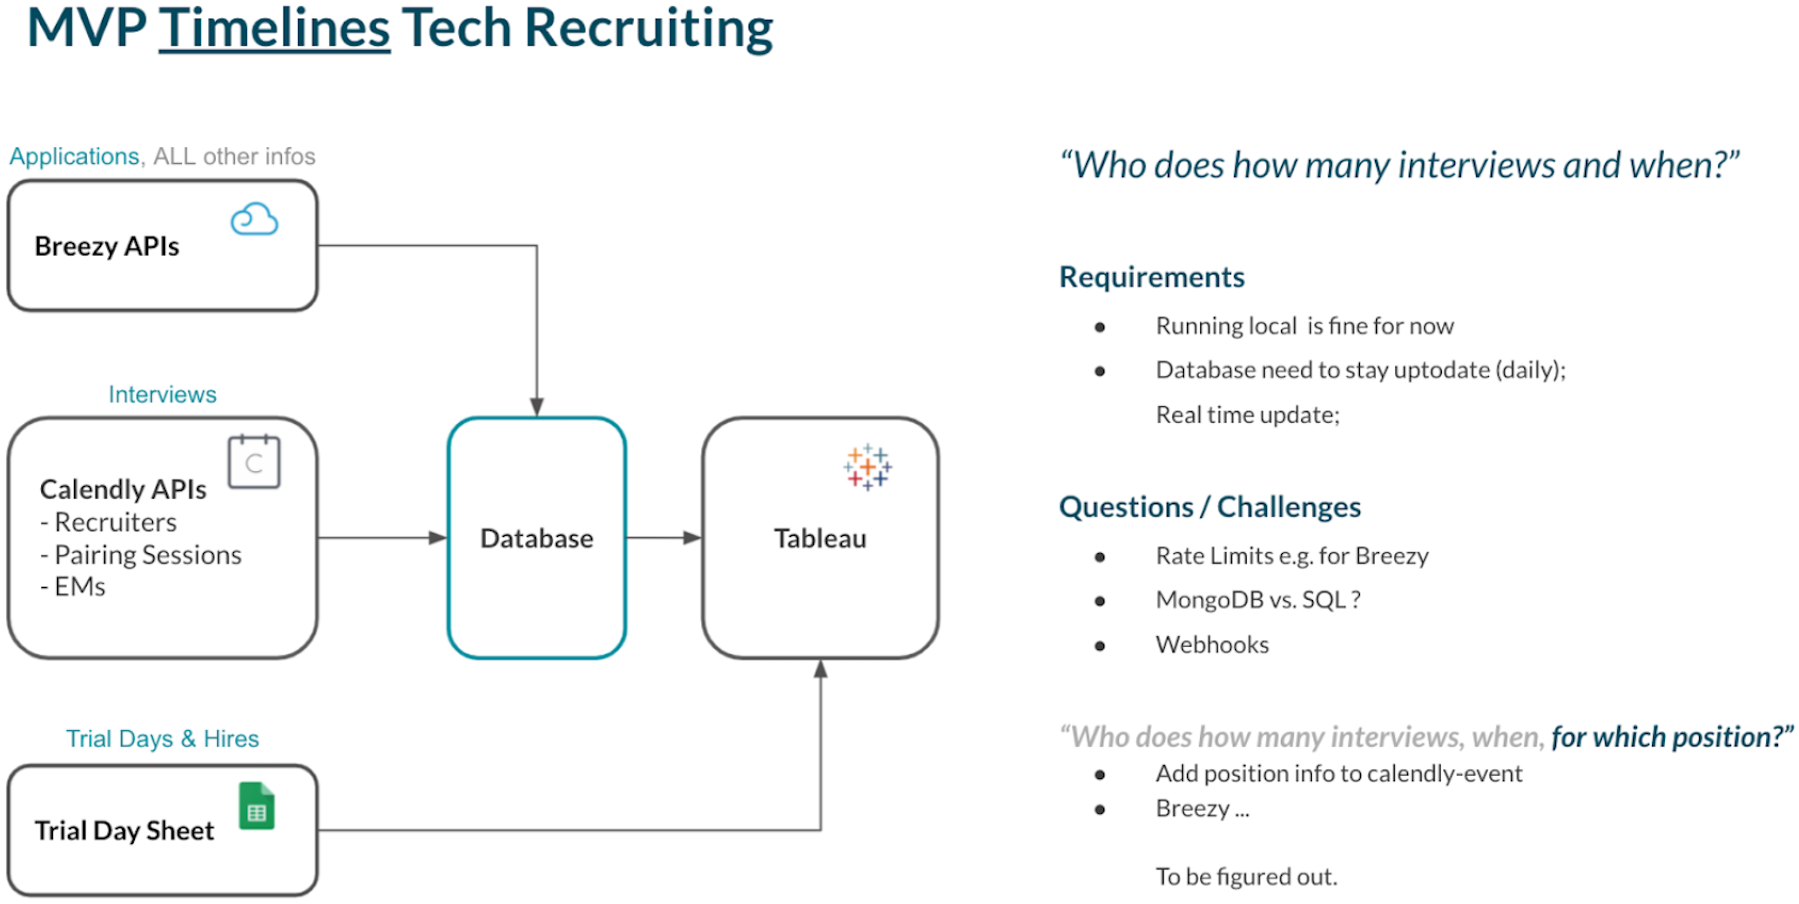
It comes not as a surprise that most of the data we are looking for lives in the application tracking system itself. In our case, this is Breezy. But often we also use Calendly for scheduling interviews. Here we find additional time information as well as more precise information about who the interviewer was. And last but not least, some Google Sheets contain additional information that the recruiting software does not provide.
Where to start?
In order to start somewhere, it made sense to start with Breezy because the most relevant recruiting data lives here. So my very first goal was:
Build an app, that automatically:
- Gets all the data out of Breezy.
- Stored the data outside of Breezy so that I can work with it.
- Keep the database automatically updated and in sync with the data in Breezy.
And once this is done, connect the DB with Tableau and visualize the data.
Why did I choose NodeJS?
Because I wanted to learn NodeJS. Before, I already worked with Python. But why not learn something new?
Database
For my very first version I used MongoDB (NoSQL). Also here, I just wanted to look into it because I never touched NoSQL. But especially with Tableau and for several other reasons, SQL just made much more sense for this case and I realized that pretty soon.
Tableau
I worked with Tableau before. And before picking up another frontend data visualization framework, I thought I got my hands full with the backend task ahead.
Let’s get technical
Accessing the data - What is an API?
Typically, all applications and services on the internet (like Breezy) make their data accessible for programmers through APIs (pretty sure you heard about this term at least 1 mio times). Think about an API as a gate for the data of an App. Data can flow in through an API, and data can flow out.
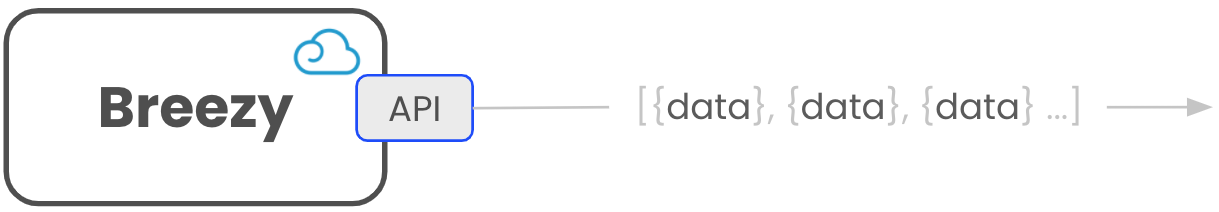
From a consumer’s perspective, an API is nothing else than a URL. When you type into the address bar of your browser https://chungwin.com/ your browser sends a request to a server, the server responds, your browser receives the response and renders the received information on your screen.
In the same way you can say to your NodeJS app to make a request to one of the Breezy APIs (together with an access token) and the APIs will give you a repsonse.
In this case, the Breezy API for positions will respond with information about the positions you have stored within Breezy.
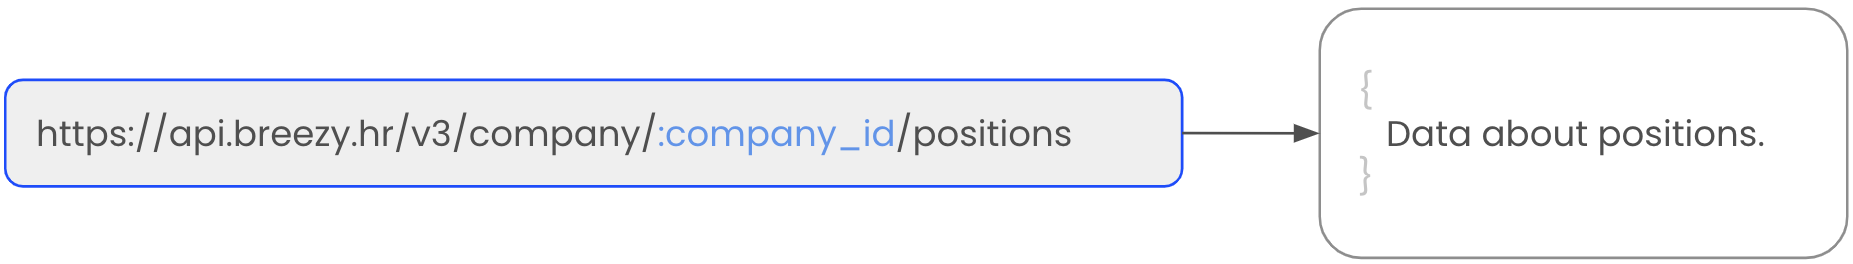
Because there is a lot of different information in Breezy, there are a lot of different endpoints to access this information. E.g. if you want to access the information about the candidates within a specific position, Breezy provides the following API for candidates

To use this API, you have to specify the position of which you want to receive the candidate information. You do that by providing the position_id in the URL.
With the dashboard as the end goal in mind, I became aware that I probably have to collect all required infos from different APIs and bring them together.
Let’s start coding!
Dear NodeJS-App,
- Go to the API and make a GET-request.
- Receive the response from the server.
The format in which you typically receive the response from an API is called JSON. Once you receive the JSON-response, you basically tell your app …
- Once you get the response, clean it up a bit,
- Put it in a structure so that we can work with it.
- And once you done that, put the data into a database called “positions.
Depending on how many positions you got stored in your application tracking system over the course of time, you end up with, let’s say 150 positions. You could also specify the API call so that you just fetch the data for open roles. But for the sake of completeness, let’s get them all.
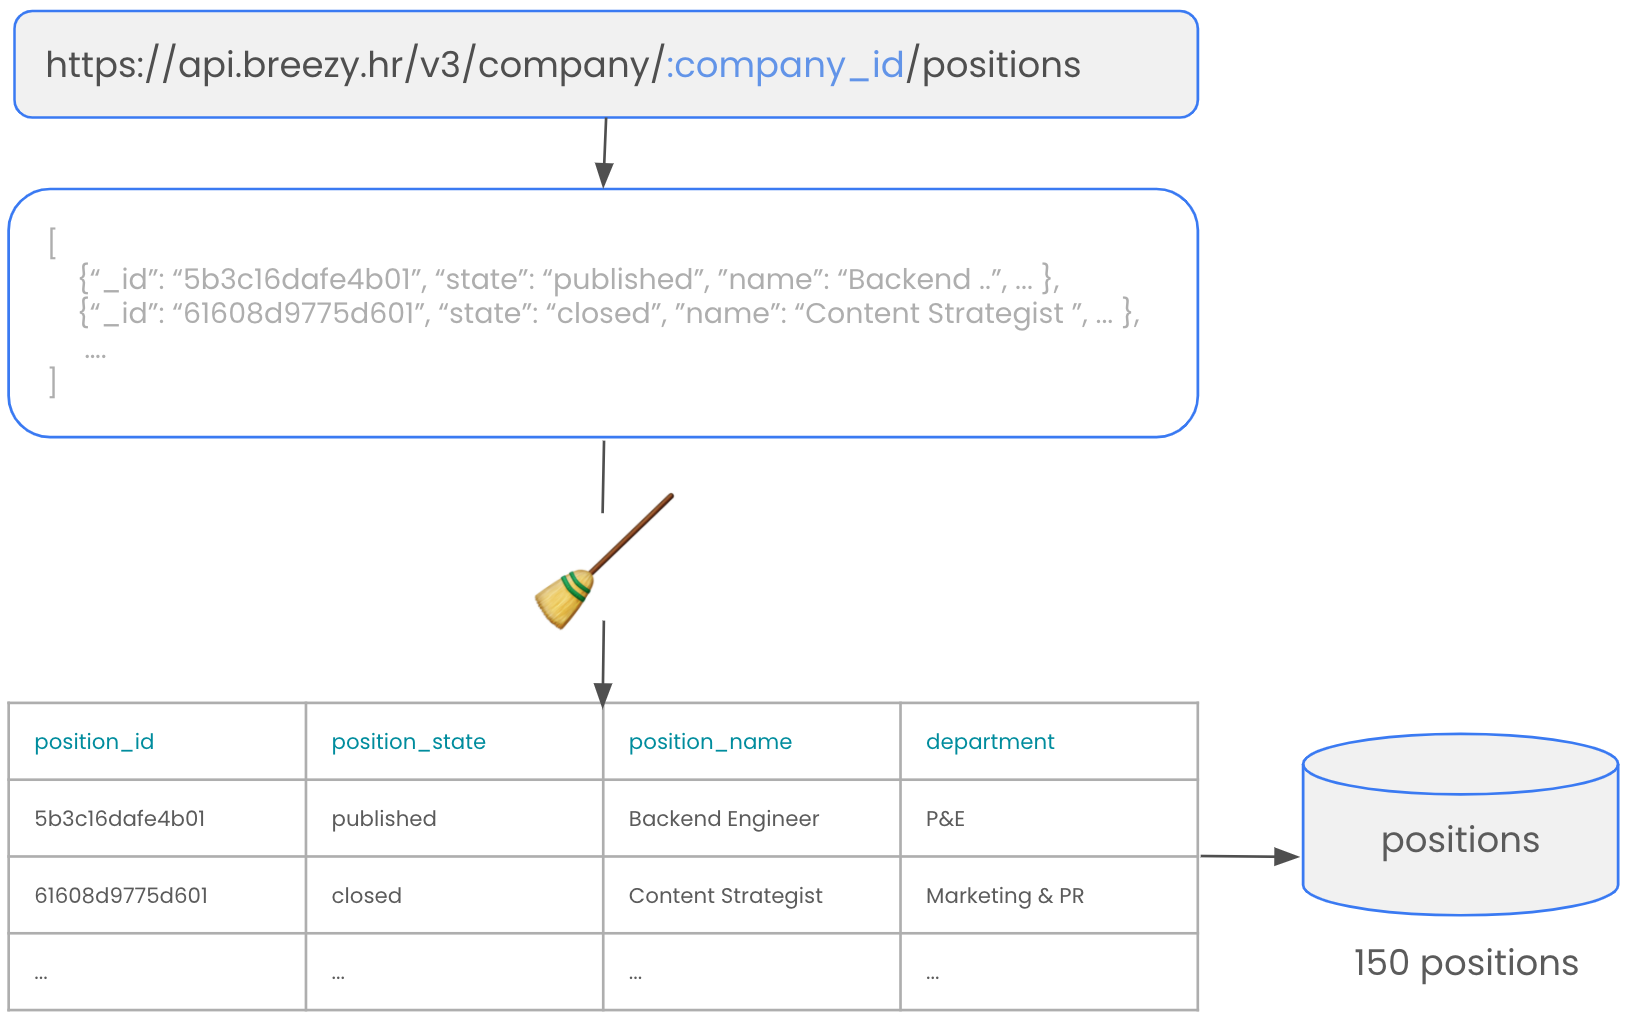
That’s already pretty cool. But of course we are far from done yet. If you look at the data we get from this API, you see that the only useful data for us are the fields position_name, ID, status of the position and the department. Next, we want to get the information about the candidates for these positions.
As shown before, if we want to get this information, Breezy provides another endpoint in which you have to specify the position_id of the position you want to have the candidates from.
So what we do next is the following. We say to your app:
Dear NodeJS-App,
- please go to the positions_DB you just created,
- get all the position_IDs from the positions,
- then, put the first ID into the API,
- make a request, receive the data,
- once you receive the data, clean it up again, and put it in a nice structure so that we can work with it,
- put the data into a DB called “candidates”
- and once you did that for the first position, take the next position_ID and repeat 150 times. ...
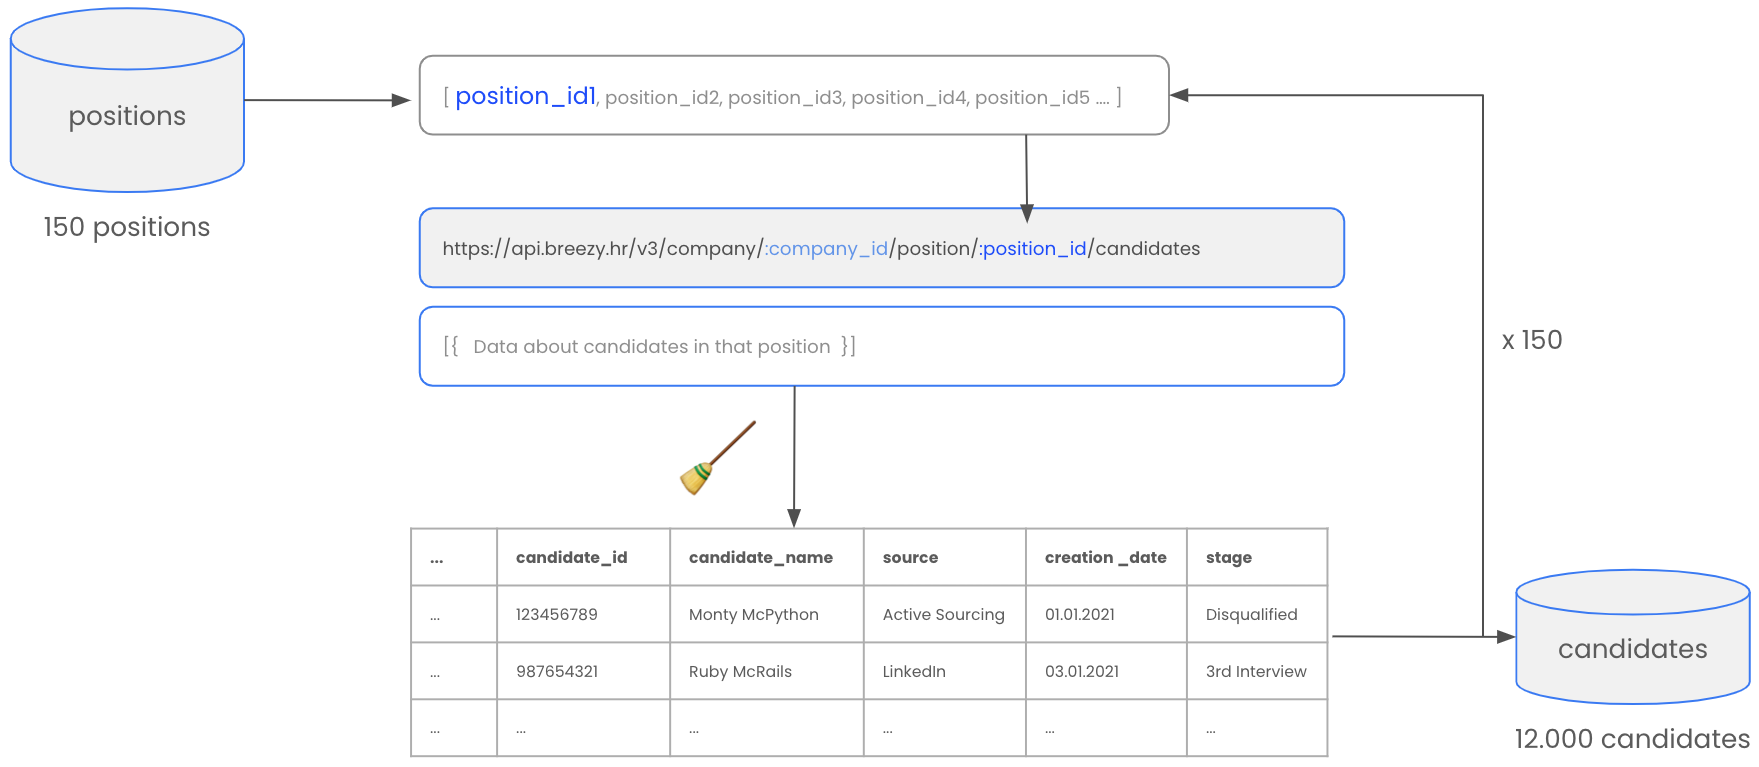
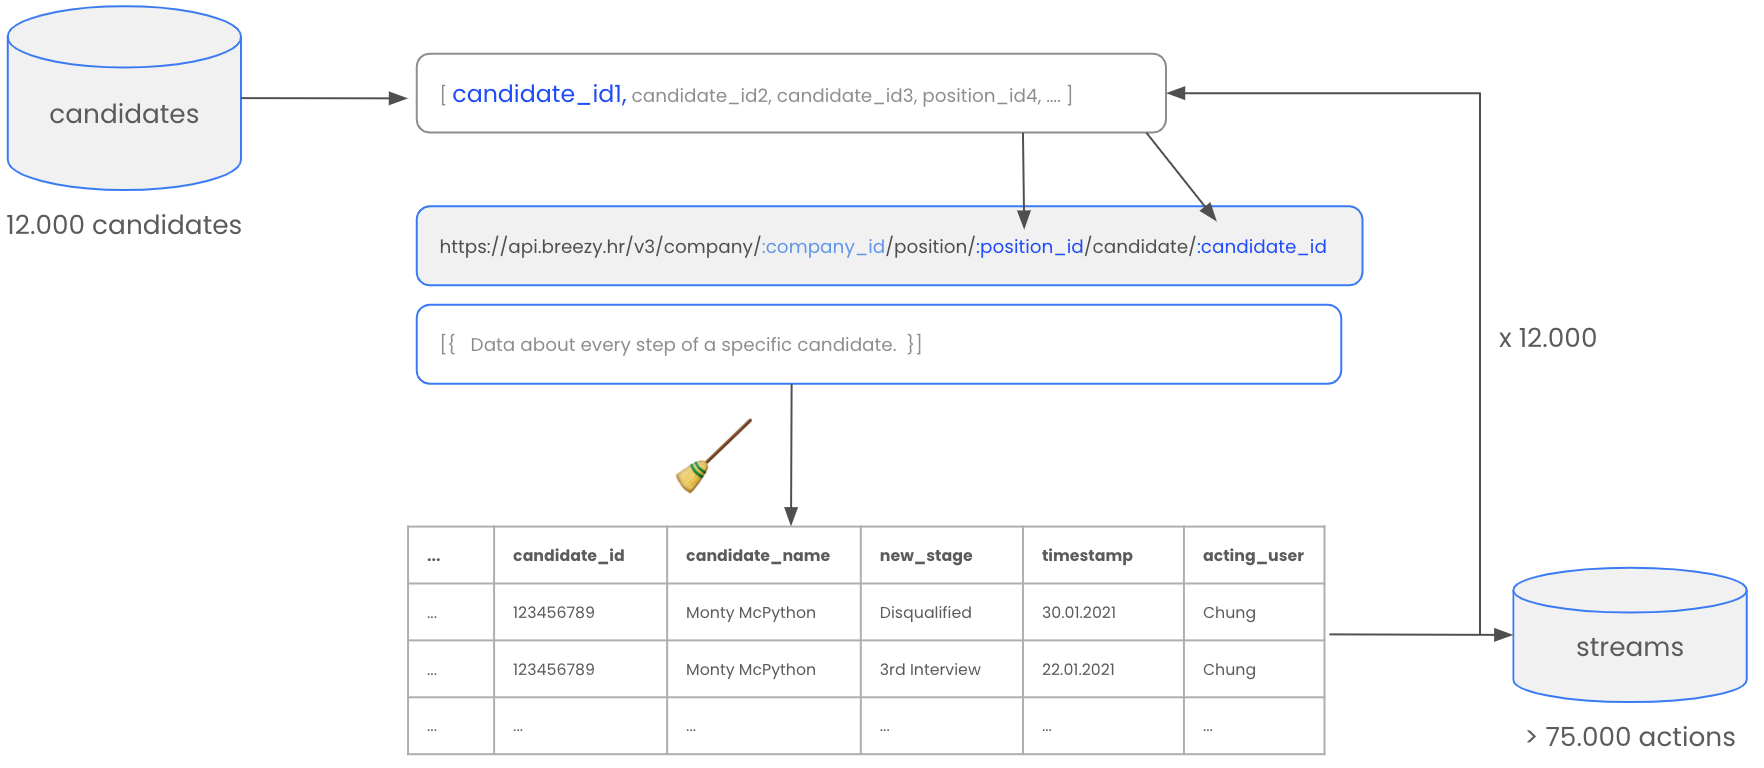
Nice! Now we have informations about 12.000 candidates, like their unique ID, name (if not anonymized), source, date when they entered the system, their current stage etc. But we do not just want to know what the candidate’s current states is. What is particularly interesting for us is how they got to their current or final stage.
And also for these inforamtions Breezy provides an API for which we have all the inforamtion in place to use it. So we say to our app:
Dear NodeJS-App,
- please go to the candidates_DB you just created,
- get all the candidate_IDs and their position_IDS they belong to,
- then, put the first position_ID and candidate_ID into the API,
- make a request, receive the data,
- once you receive the data, clean it up again, and put it in a nice structure so that we can work with it,
- put the data into a DB called “stremas”
- and once you did that for the first candidate, take the next candidate and repeat 12.000 times. ...
Et voilà. From a data perspective, we have now all inforamtions we need in order to create the funnel chart and calculate the conversions for each step.
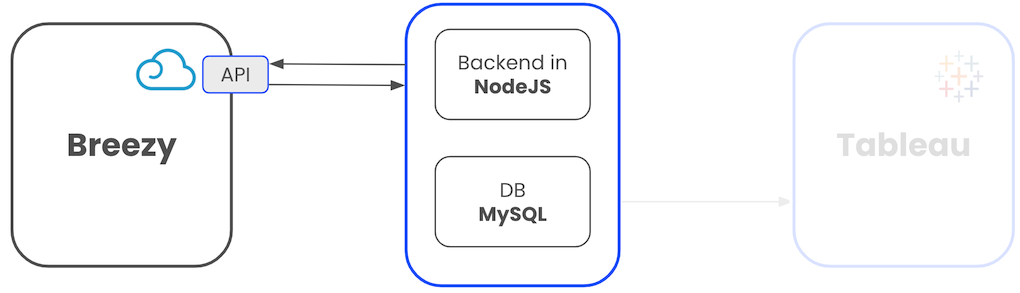
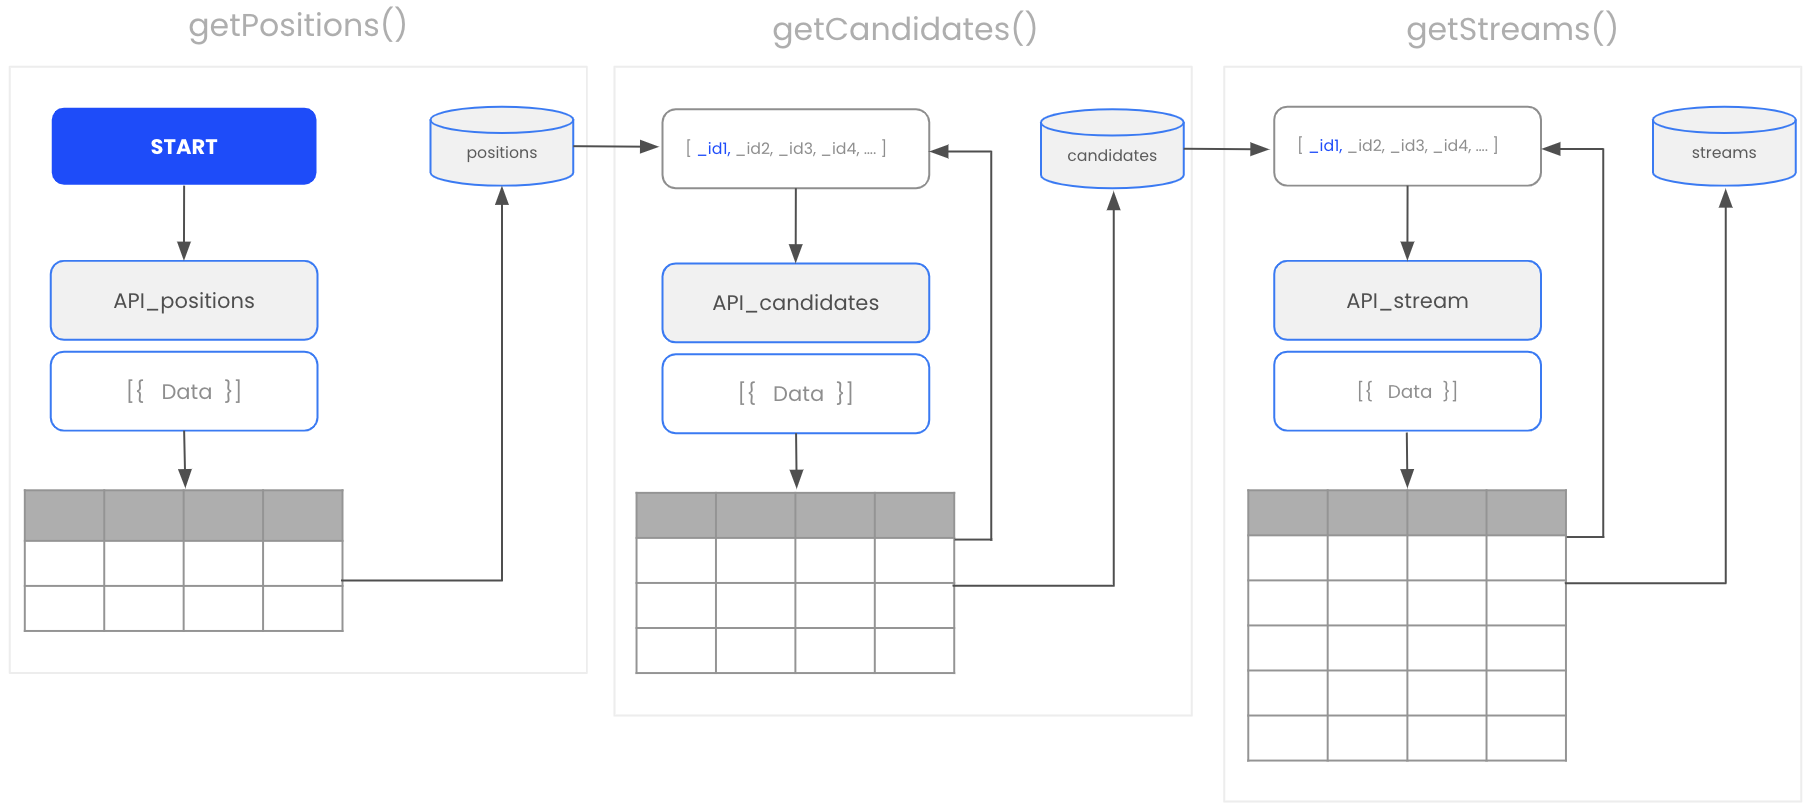
The overall architecture and data structure we created looks like this.
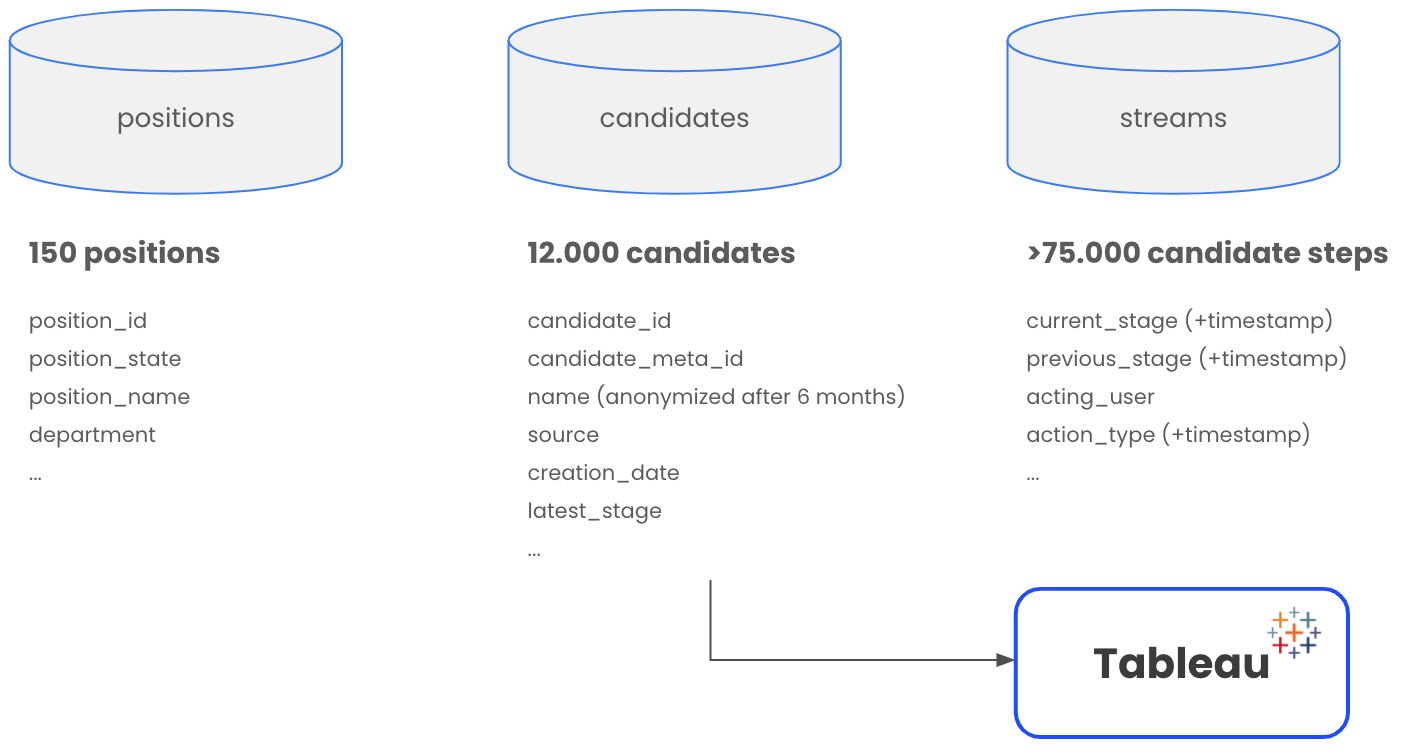
There are many ways how you can visulize the results, create reports and dashbaords. For me personally, Tableau is my go-to tool for data visualization. But at the end of the day, it’s not about the tool. How good your reporting is correlates directly with the quality of data you are able to generate. One you took care of that, everything else takes care of it self.
This quick technical runthrough is a simplified illustration but provides a pretty accurate overview of the most essential steps that need to be taken in order to come up with the reporting we aimed for. Along the way, many other hurdles need to be taken. Challenges that feel like distracting from the “actaul goal”, but are more often the actual path one has to walk. Error handling, tracing, and logging are essential for the progress of the project as well as for the experience of the programmer. At some point, version control makes life so much easier. And all of a sudden you find yourself on different branches of your project, dealing with credentials, make a database run, deployment etc.
I’m a self-taught programmer. And this project was one of my most important programming learning experiences because it made me deal with so many construction areas that I haven’t thought of before, besides the actual programming itself. I guess a small summary of my personal learning from this project is worth a dedicated post. Stay tuned.